Spotting new bay additions before the interconnection filing goes public
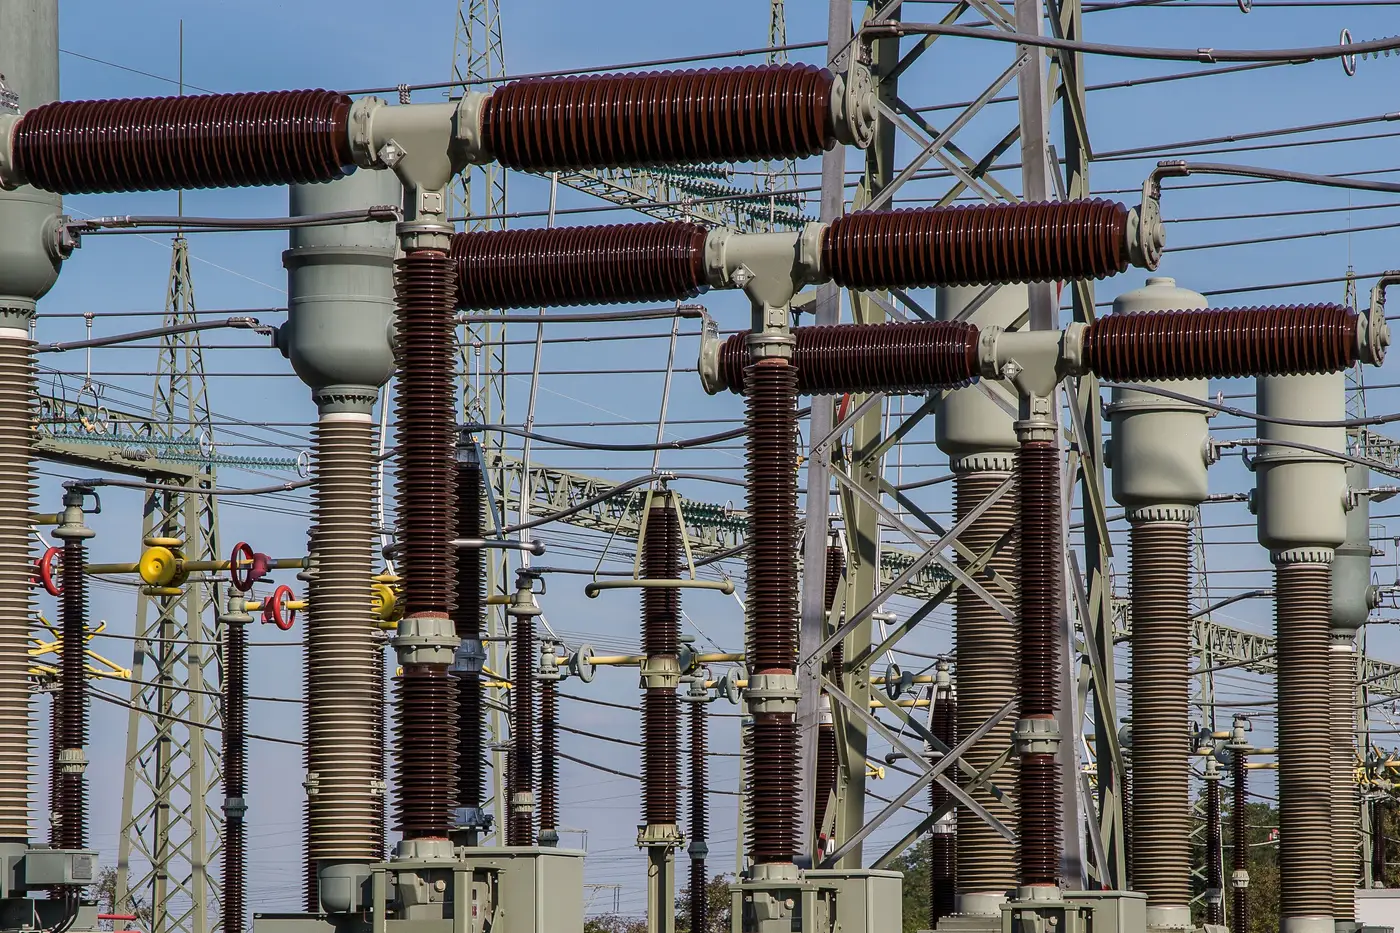
By the time an SGIA or a system impact study summary lands in the public queue, the steel's usually been in the ground for a while. Permitting, procurement, construction, energization testing: all of that happens before anyone outside the interconnecting utility files a word. If your job is tracking capacity build-out on a neighboring system, or even confirming what your own field crews built versus what got scoped, waiting on the filing means you're working off old news.
There's a gap between "a bay got added" and "the public record says a bay got added." For a lot of ISO/RTO queues that gap runs a year or more, longer if the project sits behind a cluster study. Nothing illegal or sneaky about it, that's just how the process works. But if you need an early read on where capacity is showing up on the ground, the filing isn't the thing to watch.
Why the filing always comes late
Interconnection filings document a legal and technical process, not a construction timeline. A utility can pour foundations, set a transformer, string a new bay, and energize it well before the corresponding SGIA, facilities study, or queue status update shows up anywhere you can pull it. OASIS postings and queue trackers get updated on the utility's schedule, not on a schedule that matches when breakers actually get set.
Site visits solve the lag problem but only for substations you can get to. A yard three states over, or one owned by a neighboring transmission owner who has no reason to let you walk the fence line, isn't an option. Same goes for anything behind a locked gate for security reasons, which is most of the fleet these days.
What a new bay looks like from overhead
This is where imagery earns its keep. A bay addition changes the footprint in ways that show up clean in a high-resolution pass: a new string of structures parallel to the existing bays, a transformer pad poured where there was gravel or grass last quarter, new bus work tying into the existing rack, graded yard space that wasn't graded before. None of that requires reading a one-line diagram. It's visible construction, and at sub-meter resolution it's countable.
The trick is having something to compare against. One image of a substation tells you what's there today. It doesn't tell you what changed. What you need is the same footprint, shot at roughly the same angle, pulled at intervals, so a new transformer position or an extra bay reads as a difference against the last pass rather than something you have to notice cold. That's the whole mechanism: pass-over-pass comparison, flagged where the footprint moved.
Run that on a quarterly cadence against the sites on your watch list and you get a read on build-out that doesn't depend on anyone filing anything. You see the bay before you see the paperwork. For a neighboring utility's expansion plans, or confirming your own crews finished what the work order said, that's the difference between planning off a nine-month-old queue entry and planning off what's standing in the yard right now.
It also catches the stuff that never makes a public filing at all. Security-relevant construction, equipment staging, yard activity tied to maintenance rather than a generator interconnection. None of that generates a queue entry, but all of it shows up in the footprint. If part of your job is just knowing what's happening at a site you can't walk into, imagery is doing work the interconnection process was never built to do.
Grid Change Monitor runs exactly this comparison, site by site, and delivers the change list each quarter: new bays, transformer additions, yard construction, flagged against the last pass so you're not scanning raw imagery looking for it yourself. If your watch list includes substations you can't visit and can't wait on a filing to understand, that's worth a look.