How to read an interconnection queue report
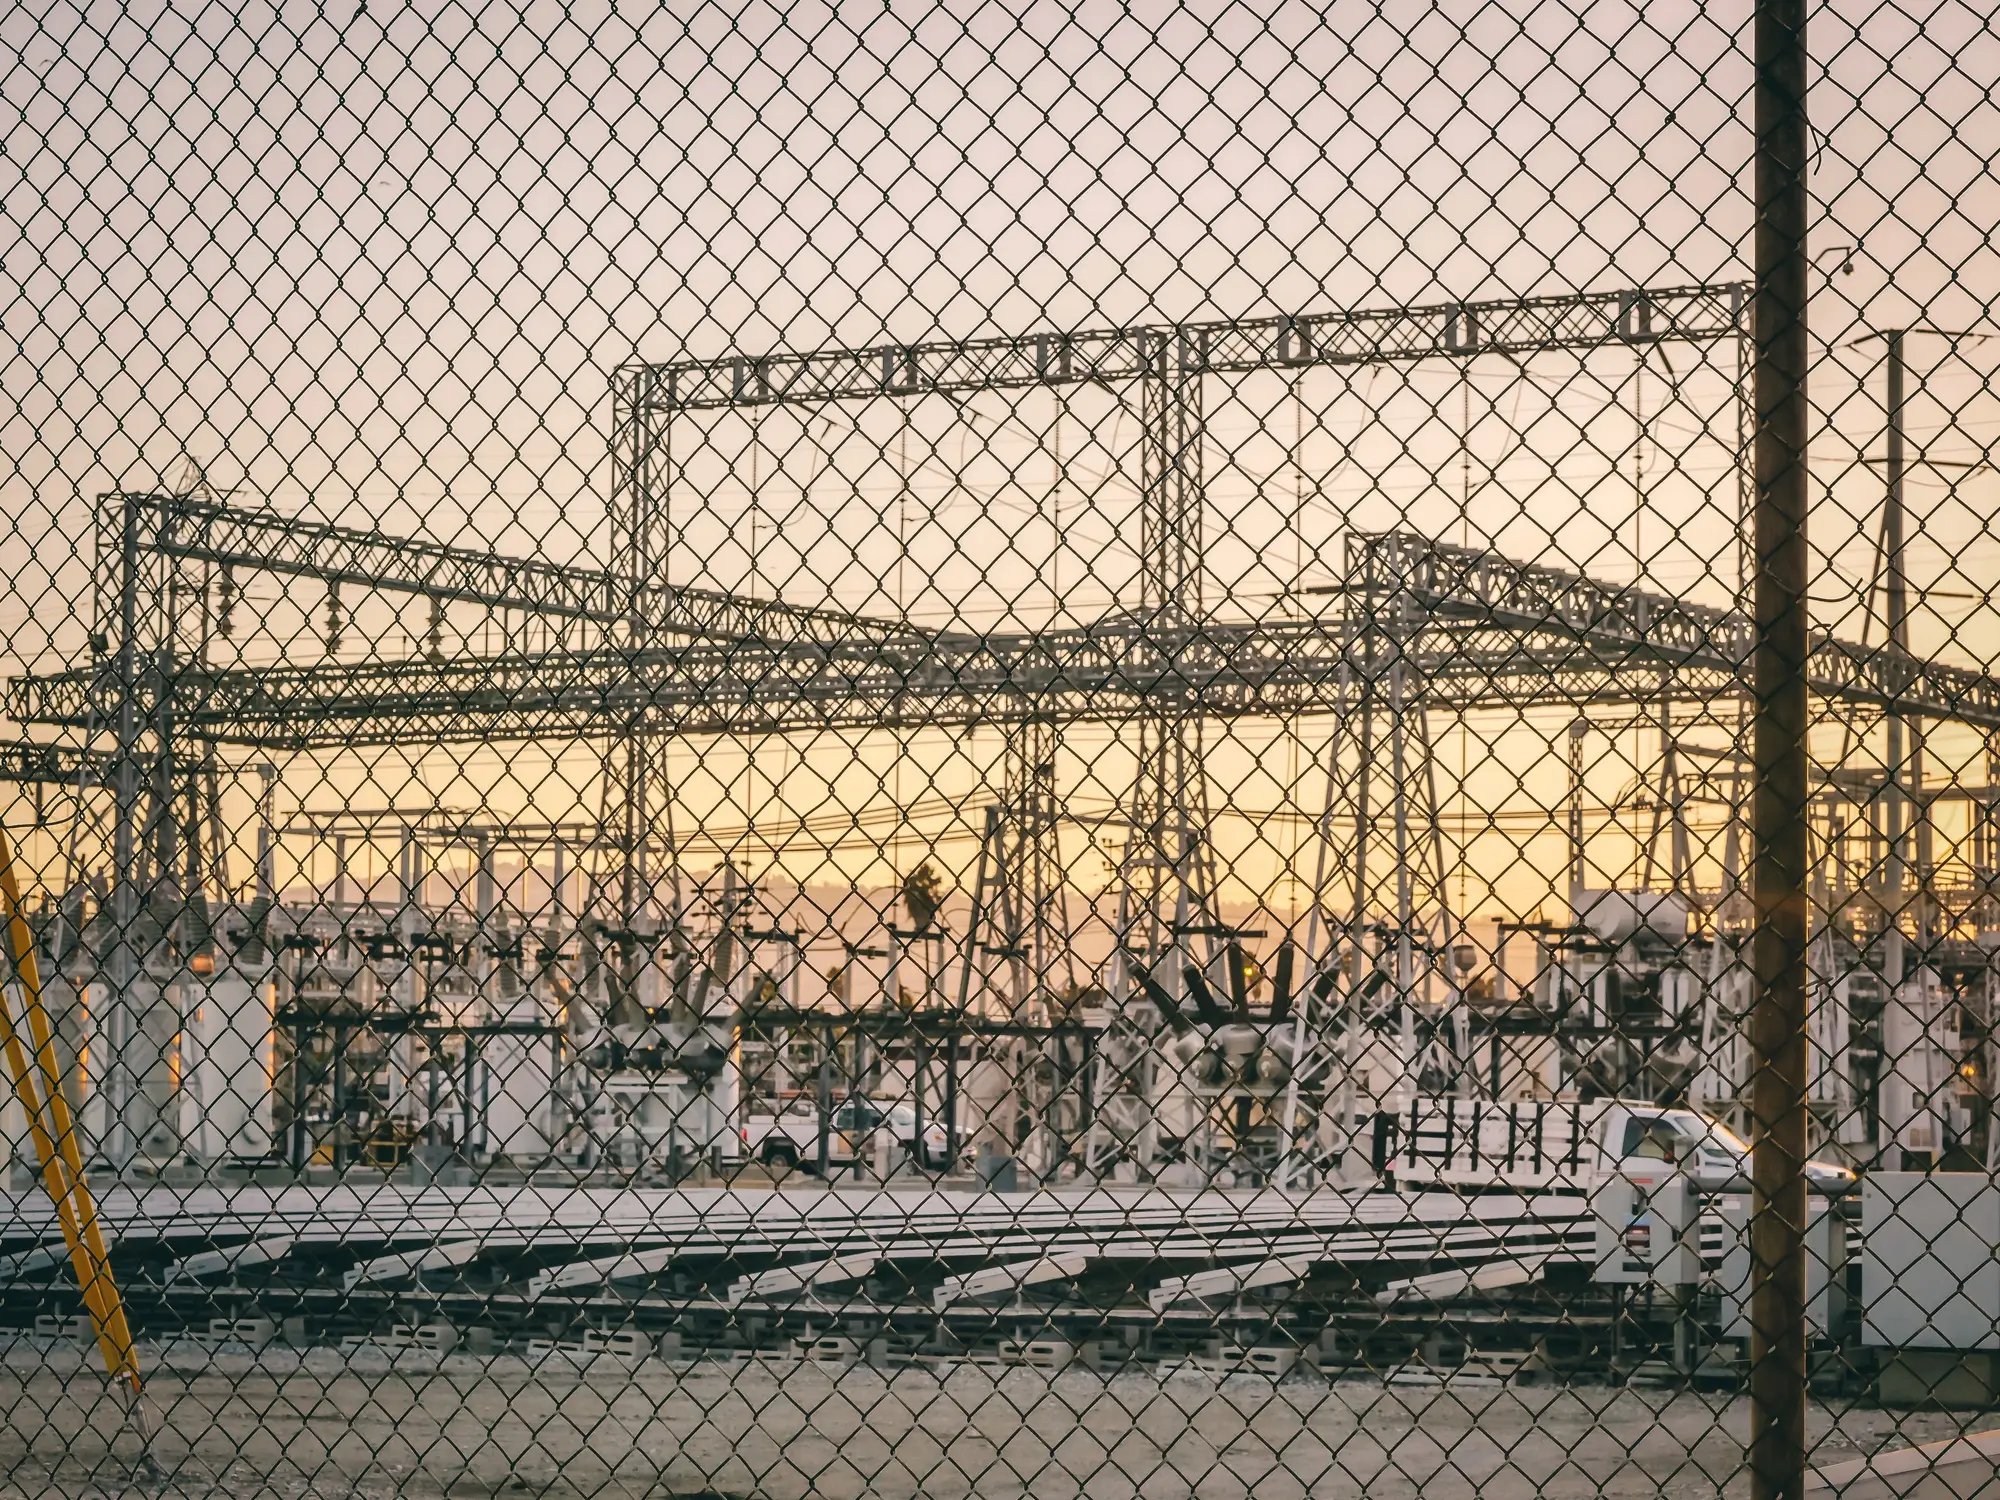
Pull up any ISO or RTO's public queue report and the first reaction is usually the same: a few thousand rows, half the columns abbreviated, and no legend in sight. PJM, MISO, SPP, CAISO and the rest all publish some version of this spreadsheet, and they all assume you already know what you're looking at. Here's what the columns mean and what they don't tell you.
The columns that actually matter
Most queue reports boil down to seven or eight fields worth tracking:
Queue position is the project's place in line, usually a code like AB1-234 or a straight number assigned the day the interconnection request was filed. It sets study order, not construction order. A project filed in 2019 can still be sitting in system impact studies while a 2022 filing with fewer conflicts clears facilities study first.
Point of interconnection (POI) names the substation or line tap. This is the field you'll search first if you're tracking build-out at a specific site, and it's also the one most prone to getting updated mid-process when a developer switches POIs to dodge a bad system impact result.
MW requested is the nameplate capacity on the interconnection request, the figure before any derates, splits, or shrinkage. Projects shrink, split, or get derated during facilities study all the time, so treat this number as a ceiling the project might reach, rarely the amount that gets built.
Study status tracks where the request sits: feasibility study, system impact study (SIS), facilities study, or executed interconnection agreement (SGIA/LGIA). Each phase has its own queue, its own backlog, and in most RTOs now, its own cluster.
In-service date requested is the developer's ask, not a commitment the transmission owner has made. In tight queues this date routinely slips two or three years past what's filed.
Status flag (active, suspended, withdrawn) is the field analysts skim past and shouldn't. Withdrawal rates in some queues run well over half of all filed capacity. A withdrawn project frees capacity that re-enters the queue for the next cluster, which is exactly the kind of shift that makes last quarter's report stale.
Reading queue position like a planner, not a spreadsheet
Queue position tells you sequence, but under FERC Order 2023 cluster study rules, sequence inside a cluster isn't strictly first-come-first-served anymore. Projects in the same cluster get studied together, and a restudy triggered by one withdrawal can reshuffle cost allocation for everyone else in that cohort. If you're trying to figure out whether a given project is going to need new substation capacity at your POI, the cluster it landed in and whether that cluster has already been through its first restudy cycle matter more than its raw position in line.
The cost allocation group field, where it's published, is worth cross-referencing against POI. Two projects can share a POI and a cluster and still carry completely different network upgrade obligations depending on when they entered.
Where the report stops being useful
None of this tells you what's physically happening at the substation. A queue study report is a snapshot of paperwork, filed, studied, and occasionally withdrawn, often a year or two behind whatever's being poured and strung on site. Utilities add bays, swap transformers, and expand yards for reasons that never touch a public interconnection queue at all: internal load growth, reliability upgrades, a neighboring utility's own capacity build that shows up nowhere in your RTO's filings.
That gap is the reason a lot of planning groups now run an imagery pass alongside the queue report, something like a quarterly change list that flags new bays, transformer additions and yard construction at substations you can't drive out to every month. It won't tell you a project's queue position. It will tell you whether the ground has already moved before the paperwork catches up.
If your queue report keeps surprising you with capacity that was apparently under construction for a year before anyone filed anything, that's worth a second look from Grid Change Monitor.